home
 Economy Economy
 Books Books
 The global trading system: rozvitok institutes, rules, labor of SOT - Tsigankova TM The global trading system: rozvitok institutes, rules, labor of SOT - Tsigankova TM
|
The global trading system: rozvitok institutes, rules, labor of SOT - Tsigankova TM
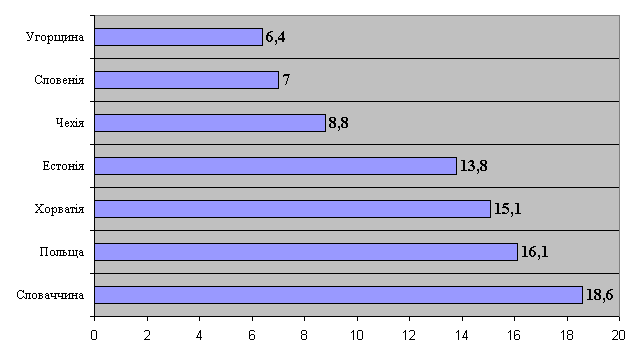
Dodatok 24. A riot of bezrobitsya in the Central region of the Sci-dno-Europe in 2000. [4. P.24] (%)

Dodatok 25. Dynamics of real GDP in the other group of countries with a recurring economic impact, they came to the SOT of 1995. (%)
| Krayina | Rocky |
||||||
1996 |
1997 |
1998 |
1999 |
2000 |
2001 |
2002 |
|
|
Albania * 15 (2001) |
9.1 |
-7 |
8 |
7.3 |
7.8 |
6.5 |
6th |
|
Bulgaria (1996) |
-9.4 |
-5.6 |
4 |
2.3 |
5.4 |
4 |
4 |
|
Freight (2000) |
10.6 |
10.8 |
2.9 |
3 |
2 |
4,5 |
3.5 |
|
Естонія (1999) |
3.9 |
9.8 |
4.6 |
-0.6 |
7.1 |
5 |
4 |
|
Kyrgyzstan (1998) |
7.1 |
9.9 |
2.1 |
3.7 |
5.1 |
5.3 |
2 |
|
Latvia (1999) |
3.7 |
8.4 |
4.8 |
2.8 |
6.8 |
7.7 |
4 |
|
Lithuania (2001) |
4.7 |
7.3 |
5.1 |
-3,9 |
3.8 |
5.9 |
5.2 |
|
Moldova (2001) |
-5.9 |
1.6 |
-6.5 |
-3,4 |
2.1 |
6.1 |
3.5 |
|
Croatia (2000) |
6th |
6.5 |
2.5 |
-0.9 |
2.9 |
3.8 |
3.5 |
* 15: {Ric to the entry into the COT.}
Додаток 26. Динаміка обсягів експорту в другій групі країн з перехідною економікою, що приєдналися
Mln.
| Krayina | Rocky |
|||||
1996 |
1997 |
1998 |
1999 |
2000 |
2001 |
|
|
Albania * 17 (2001) |
207 |
139 |
205 |
264 |
262 |
302 |
|
Bulgaria (1996) |
6602 |
5323 |
4299 |
3964 |
4809 |
5074 |
|
Freight (2000) |
199 |
240 |
192 |
238 |
330 |
375 |
|
Естонія (1999) |
2077 |
2924 |
3131 |
2936 |
3133 |
3275 |
|
Kyrgyzstan (1998) |
505 |
604 |
514 |
454 |
505 |
543 |
|
Latvia (1999) |
1443 |
1672 |
1811 |
1723 |
1865 |
2001 |
|
Lithuania (2001) |
3355 |
3860 |
3711 |
3004 |
3814 |
4583 |
|
Moldova (2001) |
805 |
890 |
644 |
465 |
472 |
664 |
|
Croatia (2000) |
4512 |
4171 |
4541 |
4303 |
4432 |
4659 |
* 17: {Ric to the entry into the COT.}
Dodatok 27. Dynamika of the Obligations of Direct In-Ground Investments in the Territories of the Economical Economy
| Krayina | Rocky |
||||
1996 |
1997 |
1998 |
1999 |
2000 |
|
|
Albania * 19 (2001) |
90 |
48 |
45 |
41 |
92 |
|
Bulgaria (1996) |
109 |
505 |
537 |
819 |
1002 |
|
Freight (2000) |
45 |
243 |
265 |
82 |
197 |
|
Естонія (1999) |
151 |
267 |
581 |
305 |
398 |
|
Kyrgyzstan (1998) |
47 |
83 |
109 |
35 |
19 |
|
Latvia (1999) |
382 |
521 |
357 |
348 |
407 |
|
Lithuania (2001) |
152 |
355 |
926 |
486 |
379 |
|
Moldova (2001) |
24 |
79 |
74 |
39 |
128 |
|
Croatia (2000). |
511 |
540 |
935 |
1474 |
899 |
* 19: {Ric to the entry into the COT.}


Comments
When commenting on, remember that the content and tone of your message can hurt the feelings of real people, show respect and tolerance to your interlocutors even if you do not share their opinion, your behavior in the conditions of freedom of expression and anonymity provided by the Internet, changes Not only virtual, but also the real world. All comments are hidden from the index, spam is controlled.