
| home
|
Basics of Marketing - Kotler Philip
Marketing budget development
Now we will consider the process of developing a marketing budget, designed to provide access to a given level of sales and profit. First, a clear example of the usual scheme for developing such a budget will be given, and then we will talk about some techniques for improving it.
PLANNING BASED ON INDICATORS OF TARGETED PROFIT. Suppose that John Smith, who manages the production of ketchup in Heinz, will develop a marketing plan for the year. He most likely will adhere to the scheme given in Table. 23 and received the name of planning based on the target profit indicators. This scheme involves planning in several stages:
Stage 1: John Smith begins to assess the total market volume of ketchup for the next year. The valuation is formed by comparing the recent growth rates of the market (6%) with the market volume in the current year (23.6 million boxes). Based on this, the estimated market volume should be 25 million boxes.
Stage 2: Smith predicts the share of Heinz in the ketchup market next year. In this case, he believes that the firm will retain a 28% share of this market.
Stage 3: Smith predicts the sales volume of Heinz for the coming year. If the total volume of the market is 25 million boxes, while maintaining the existing market share of the company (28%), the estimated volume of its sales will be 7 million boxes.
Step 4: Smith determines the price at which the goods will be sold to distributors - $ 4.45 per box.
Stage 5: Now Smith is able to calculate the amount of revenue next year - 31.15 million dollars. This figure he receives, multiplying the estimated sales volume (7 million boxes) by the price per box ($ 4.45)
Step 6: Smith calculates that the sum of the variable costs for the goods box is $ 2.75. This figure is made up of the following costs: tomatoes and spices - $ 0.5, bottles and caps - 1, labor - 1.1, organization Commodity circulation - 0,15 dollars.
Step 7: Subtracting the sum of the variable costs ($ 2.75 per box) from the sales price of the goods ($ 4.45 per box) and multiplying the difference by the estimated sales figure (7 million boxes), Smith can forecast gross profit , Due to which will cover the constant costs and costs of marketing and generate revenue. Gross profit will amount to 11.9 million dollars.
Step 8: Smith calculates fixed costs, multiplying the fixed costs per box by $ 1 per 7 million boxes, which gives a figure of $ 7 million.
Step 9: Smith has already calculated the gross profit of $ 11.9 million, which will cover the fixed costs, marketing costs and revenue. Subtracting from this amount the amount of fixed costs of $ 7 million, Smith receives a difference that will pay for marketing costs and revenue, $ 4.9 million.
Step 10: Benchmark target profit from the sale of ketchup - $ 1.9 million.
Step 11: Subtracting the amount of the target profit ($ 1.9 million) from the gross profit portion for marketing and revenue ($ 4.9 million), gives a difference of $ 3 million that And you can spend it on marketing.
Step 12: Smith distributes a $ 3 million marketing budget for components of the marketing mix, such as advertising, sales promotion and marketing research. The breakdown is usually made in the same proportions as last year, when two-thirds of the funds were allocated for advertising, a little less than 1/3 for sales promotion, and a small balance for marketing research.
Table 23. Target profit planning
Planning stages |
Estimated result |
1. Forecast of total market volume |
25 million boxes |
2. Forecast of market share of the firm |
28% |
3. Forecast of sales volume |
7 million boxes |
4. Establishment of the sales price by the distributor |
4.45 dollars per box |
5. calculation of the amount of proceeds from sales |
$ 31.15 million |
6. Calculation of the sum of variable costs |
$ 2.75 per box |
7. Calculation of the amount of gross profit, which is covered by fixed costs, the cost of marketing and revenue is extracted |
11.9 million dollars. |
8. Calculation of the sum of fixed costs |
$ 7 million |
9. Calculation of the portion of gross profit to cover the costs of marketing and revenue generation |
$ 4.9 million |
10. Calculation of the amount of the target profit |
$ 1.9 million |
11. Calculation of the amount of possible marketing costs |
$ 3 million |
|
12. Breakdown of the marketing budget: Advertising Sales promotion Marketing research |
$ 2 million $ 0.9 million $ 0.1 million |
PLANNING BASED ON OPTIMIZATION OF PROFIT. Planning based on the target profit indicators provides a satisfactory, but not necessarily the maximum profit. And now we will dwell on the problems of developing a profit optimization plan. Profit optimization requires the manager to clearly understand the relationship between sales and various components of the marketing mix. To ensure the relationship between the sales volume and one or more elements of the marketing mix, we will use the term sales response function.
The function of the sales reaction is the forecast of the probable sales volume over a certain period of time at different cost levels for one or more elements of the marketing mix.
One of the possible functions of the sales reaction is shown in Fig. 88. It shows that the more a firm spends within a specific time frame for marketing, the higher the probable sales volume. The figure shows the curve in the form of the letter S, but it can have a different appearance. The S-shaped curve suggests that a low level of marketing costs ($ 100,000) is unlikely to result in a large increase in sales. The company's appeal either covers an insufficient number of buyers, or does it insufficiently effectively. A higher level of marketing costs ($ 200,000) ensures a higher level of sales. However, a very high level of costs may not produce a proportionately large increase in sales, triggering the effect of so-called "marketing search".
Marketing expenses for a certain period of time, thousand dollars.
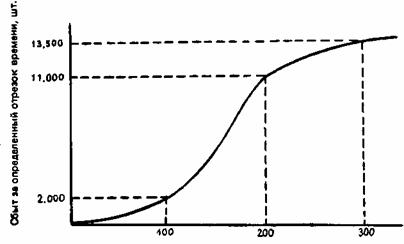
Fig. 88. Possible form of the function of the sales reaction
The reduction in sales at very high costs is due to a number of reasons. First, there is an upper limit to the total potential demand for any particular product. The most pliable potential consumers buy goods almost immediately, and stubborn - do not react. As we approach the upper limit, the attraction of the remaining potential buyers costs more and more expensive. Secondly, as the firm intensifies its marketing efforts, competitors will certainly be engaged in the same way, as a result of which each company will face growing opposition to sales. And thirdly, with constantly and invariably growing rates of sales, natural monopolies would inevitably arise. In each industry, a single firm would dominate. However, this does not happen.
How can the manager of the marketing service make a preliminary assessment of the sales response function in relation to the activities of his company? There are three ways to do this. First, there is a so-called statistical method, where the manager collects data on past sales and levels of variables in the marketing mix and estimates the sales response functions using statistical techniques. Secondly, there is an experimental method that requires varying the level of marketing costs and their distribution by similar geographic or other breakdown units, followed by measuring the sales volumes achieved7. Thirdly, there is a method of peer review, when , when establishing the necessary level of costs , they are guided by well-founded assumptions of experts8.
And how can a commercial organization take advantage of the data it has received to evaluate the functions of the sales response? In Fig. 89 shows a few more curves, with which you can reach the indicators of the optimal level of marketing costs. Let's start with the key curve - with the sales response function curve. With the exception of two differences, it resembles the S-shaped curve in Fig. 88. First, in this case, the sales response is expressed not in the number of units sold, but in the amount of money received from sales, which allows you to determine the level of marketing costs corresponding to the maximum level of profit. And secondly, the sales response function is shown starting above the zero mark, since a certain amount of sales can be observed even in the absence of marketing costs.
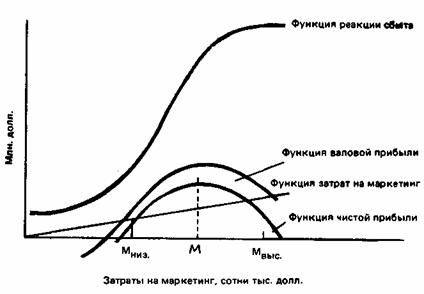
Fig. 89. The relationship between sales, marketing costs and profit
To determine the optimal level of marketing costs, the marketing manager removes all non-marketing costs from the sales response function and, as a result, receives the gross profit function. Then the function of marketing costs is presented in the form of a straight line, which starts at the zero mark and goes obliquely upwards in the ratio of $ 1 of marketing costs horizontally for every $ 10 vertically. After this, the net profit function is obtained, subtracting the function of marketing costs from the gross profit function. The net profit function indicates a positive net profit at a marketing cost level between Mile. And Mvys. This is the rational range of marketing costs. The function of net profit reaches its maximum at point M. Consequently, the level of marketing costs that ensure the maximum net profit should equal M dollars.
The graphical solution can be replaced by a numeric or algebraic one. By the way, it still has to be done if the sales volume is derived from more than one variable of the marketing complex.

Comments
When commenting on, remember that the content and tone of your message can hurt the feelings of real people, show respect and tolerance to your interlocutors even if you do not share their opinion, your behavior in the conditions of freedom of expression and anonymity provided by the Internet, changes Not only virtual, but also the real world. All comments are hidden from the index, spam is controlled.